
Introduction To Data Driven Models
- katylane6
- Oct 24, 2016
- 5 min read
We talk a lot about the benefits of process models, modeling standards, and contextually relevant data but how does it work?
Most people look at process models as pictures. We see them as ‘enhanced’ human and machine readable diagrams but diagrams nonetheless. A diagram is “a simplified drawing showing the appearance, structure, or workings of something; a schematic representation.”
Diagrams are communication mechanisms. They allow people to share ideas rapidly and collaborate to solve problems. Diagrams help us navigate from place to place or build structures, and share the abstract vision of what we want to build in a clear and concise manner.

Image Courtesy of Creative Commons
Overtime diagrams themselves and their various purposes have adopted numerous graphical standards to allow large groups of people to share ideas, build schematics to solve problems, and navigate with the same level of understanding. As computing technology evolved, graphical standards could be represented in standard data formats allowing programmers to develop software (instructions) on how to read the files for display purposes or for use in other capabilities.
We talk a lot about geographic maps and road maps because most of us have seen and interacted with both analog and digital maps. Digital maps as we know them today started out as graphical notations and standards used by people to overcome navigational challenges. Overtime these standards evolved into digital representations that have become the foundational data necessary to drive online map capabilities, GPS navigation tools, real-time traffic and routing devices, and even business transformation.

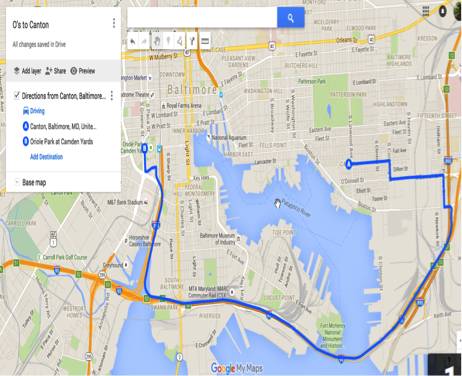


Image 1 is a screenshot of a Google Map with Layered Driving Directions and Image 2 is the same map as created, processed, displayed, and managed by the computer.
I’m sure we can agree that diagrams, standards, and models have always been at the forefront of bringing people together to solve really hard problems, improve efficiency in our lives, and generally advance our species. Part of that advancement is using computers to help us solve problems. Extending those information representation standards in a way that a computer can read and understand them has been a natural evolution.
Let’s take our map example again, things like latitude and longitude that went into hand drawn maps are simple data points in a standards based interchange file that can be used for many other purposes. Google pioneered a standard a number of years ago that is at the heart of Google maps. It is called the “Key Hole Markup Language” or KML for short. KML is now an international standard and is used to display and work with map data in various software applications for many different purposes.
So what does all this look like?
Here is a snippet of a KML file as a computer program sees it. If you look closely you will see descriptive Metadata “Placemaker”, specific places related to those tags, and a whole lot of “lat/long” locations.

Here is what that same file (model) looks like when displayed by software that is intended to read it. It looks like directions from Canton Square in Baltimore City to Oriole Park at Camden Yards. Go O’s!

I can go back in the diagram and change that same map by simply moving my endpoint to Raven’s stadium. If I did this the underlying map data would change as well. I could then add additional layers or request other information. For example, an application like Waze, a provider of real time navigation includes lots of other data alongside their foundational map to deliver additional functionality. If you spend a lot of time behind the wheel it will save you loads of time!

Waze Example with addition of crowd sourced data
Makes sense for maps but what about Business Process Management? Why is Business Process Modeling Notation (BPMN 2.0) so important? The same principles hold true, like maps BPMN models excel at helping us communicate better, share knowledge, make decisions, and allocate resources through automation and execution.
A BPMN model may look like a simple diagram with a set of informative parameters, similar to what is depicted below:

But, to a computer, the same model looks like this:

Each of the structures and parameters found in our model and subsequently in the underlying data can be read by a computer and used to drive executing principles, workflow, service orchestration, simulation, and conduct performance and risk analysis.
So what does this mean for business and IT? It means that same model can be used to not only understand but also be combined with additional information for analysis. The BPMN model can be used to understand and communicate your business. It can also serve as the foundation to measure performance, identify risks and opportunities, and plan for future improvements.
A simple case we use with clients all of the time is process, operation, system simulations, and what if analysis. Think of it as WAZE for your business, we enhance a set of models with information relevant to the simulation. After capturing a process we input specific metrics that allow us to simulate operational load, cost, bottlenecks, highest spend areas, risk (technical/operational), and more. This helps organizations understand their challenges and impacts, financial and resource cost, risk, soft cost such as consumer/stakeholder, technology cost, and tradeoffs or benefits applying various enhancements.

George Box stated, “All models are wrong but some are useful”. This is especially true when the models invested in to understand the business are the same that are used to uncover problems, formulate solutions, estimate potential solution impact, substantiate solution investment, support implementation with requirements and potentially be used to drive that execution (Model Driven Software & Configurations).
BPMN Is an Incredibly Valuable Tool For:
Business and IT analysis
Portfolio management
Simulation of existing and proposed changes (cost, resources, time)
Identification of opportunities for process or automation
Execution of Business Processes
Improved Information Management
And many others
Today’s businesses rely on complex and interrelated landscape where consumers, partners, operations, security, and information technology converge. If you don't know where you are, where you are going, and have the ability to operate quickly and decisively you will fail to keep up with those who can.
What do our customers need?
Is their information secure?
What are the riskiest aspects of our business and what are our priorities/problems? (Operations, IT, Human Resources, Consumer Focus, Logistics)
Are operations too costly?
Do we have the right information?
Is our data accurate?
Are our platforms adequate?
Can we deliver meaningful capabilities?
Can we create advantages in our supply chain?
Do our employees know where they fit, their contributions, and who picks up the process after them?
As experts do we empower employees to communicate better approaches?
The list goes on and on. Fortunately a new wave of model driven software is helping to put organizational control back into the hands of the business. Models can be used to not only analyze the organization supporting improvement efforts but models drive new capabilities. End result for a business equals reducing cost, time to market, and increasing value.
To learn more about implementing Business Process Engineering to optimize your business follow us here or contact Thought Layer at info@thoughtlayer.com.
© Thought Layer Co., 2016. Unauthorized use and/or duplication of this material without express and written permission from this site’s author and/or owner is strictly prohibited. Excerpts and links may be used, provided that full and clear credit is given to Thought Layer Co. with appropriate and specific direction to the original content.
*Box, George E. P.**; Norman R. Draper (1987). Empirical Model-Building and Response Surfaces, p. 424, Wiley. ISBN 0471810339.Apr 27, 2013
Comments